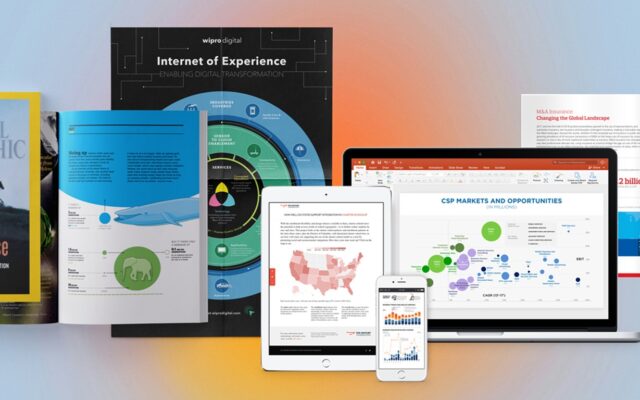
My background in communications and design provides an excellent foundation for distilling data and translating information into compelling stories through infographics and data visualization.
My background in communications and design provides an excellent foundation for distilling data and translating information into compelling stories through infographics and data visualization.

This personal interactive data visualization project aims to examine the performance of MTA’s subway service, from the on-going delays to the regularly planned service changes over the weekends.
There is no excerpt because this is a protected post.

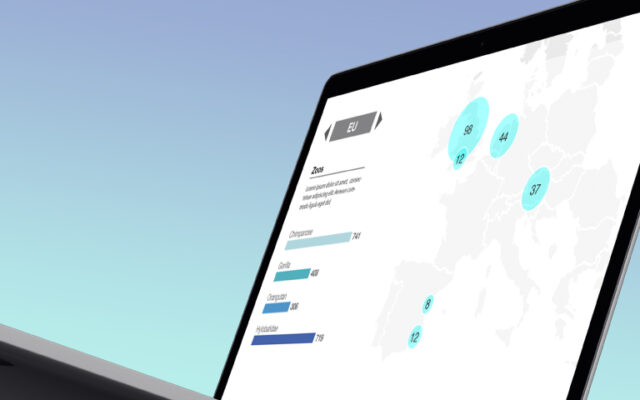
Through constant communications with the client, I was able to gain an understanding of the major goal of the project – design an interactive data visualization tool to illustrate the Chinese and Indian consumer spending in 2010 and 2020 in seven major categories and three income classes. By using Storyboard, I successfully demonstrated the complicated relationship in an interactive way.

This infographic centers around the top of the rising continent of Africa. With a steady and robust economic growth over the past decade, Africa has gradually transformed its image on the world stage, from an object of concern or pity to a more and more serious player. Data from different aspects from economy, population, infrastructure, education and investment has been visualized in formats of maps and charts.

In “Olympics 101,” I set out to create a visually engaging and informative motion graphic focused on educating audiences about the Olympics. This personal project was born from my passion for sports and design and aimed to provide a concise yet impactful overview of the history and significance of this international event.

The four-fold booklet demonstrates how the client’s product and service is influencing the growing markets in the 7 key industries of satellite communications.

Commissioned by T.Rowe Price through JWT, the infographic focuses on the growing global coffee market and how this $80 billion industry has connected the world in a web of economy, culture and politics.

The infographic and flowcharts purport to provide a detailed illustration of the modern business process automation and the comparison between the traditional and modern business network. Powered by the client’s service, organizations are able to accelerate their business and minimize cost through business process automation, which includes intelligent document capture, e-invoicing, EDI and e-archiving solutions.

With an understanding of the client’s history, services, and mission to help customers connect in a mobile-first way, I was able to collaborate with their team to craft a powerful, unique and modern visual identity for the brand, including Wordmarks, Color Palette, Icon System as well as Templates for Presentation and other Marketing Materials.