There is no excerpt because this is a protected post.
There is no excerpt because this is a protected post.


There is no excerpt because this is a protected post.
There is no excerpt because this is a protected post.
There is no excerpt because this is a protected post.

Through constant communications with the client, I was able to gain an understanding of the major goal of the project – design an interactive data visualization tool to illustrate the Chinese and Indian consumer spending in 2010 and 2020 in seven major categories and three income classes. By using Storyboard, I successfully demonstrated the complicated relationship in an interactive way.

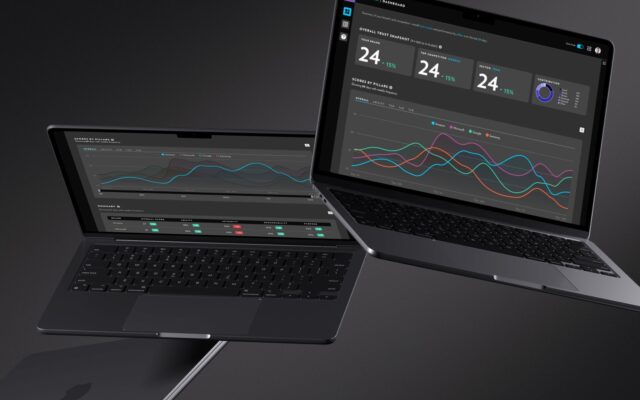
This interactive interface aims to enable the management team to monitor business performance, and encourage healthy competition between departments and branches within the group.